


Table of Contents
When comparing server control panels, discussions often focus on features, licensing costs, ease of use, and administrative convenience. Performance comparisons are harder to find—and when they do exist, they are often based on freshly installed servers running synthetic benchmarks.
I wanted to approach the question differently.
Instead of installing HestiaCP and cPanel on identical empty virtual machines and running a benchmark, I compared three actual production web servers that have been operating continuously with real websites, real visitors, WordPress installations, databases, caching, email services, security software, bots, crawlers, and the constant background noise that comes with exposing a web server to the Internet.
The question was simple:
Hestia Vs. cPanel Server Performance: Which is better under real-world conditions?
The results turned out to be more interesting than a simple winner-and-loser comparison.
Test Methodology At A Glance
3 production servers · 42 hosted sites/domains · ~304,000 requests measured · 24-hour workload samples · 180 external response-time requests · cached and uncached-style testing · production firewall/security tuning · Cloudflare disclosed
The Test Environment
The comparison involved three production servers:
| SERVER | CONTROL PANEL | SITES | ROLE |
|---|---|---|---|
| hestiaserver1 | HestiaCP | 29 | Multi-site production server |
| hestiaserver2 | HestiaCP | 9 | Higher-traffic production server |
| cpanelserver | cPanel/WHM VPS | 4 accounts | WordPress-focused production server |
All identifying server names, domains, usernames, and customer information have been removed from this article. Individual sites are referred to generically as website1, WordPress site, large website, or non-WordPress site where necessary.
This wasn’t a laboratory benchmark. The servers have different hardware configurations, site mixes, workloads, software configurations, and traffic patterns.
That’s intentional.
The objective wasn’t to determine how HestiaCP and cPanel perform on identical empty servers. It was to examine how their architectures behave after being configured, secured, optimized, and put to work in production.
An Important Note About Security Tuning
Before taking these measurements, the servers’ firewalls had already been tuned to reduce repetitive hostile traffic reaching the application stack.
This included identifying and blocking sources responsible for behavior such as automated WordPress probing, repeated requests for nonexistent PHP files, XML-RPC abuse, authentication attacks, and other clearly malicious automated activity.
That matters.
A poorly protected WordPress server can spend considerable CPU time and memory processing requests that never came from legitimate visitors. Apache or nginx may accept the connection, PHP may execute WordPress, and WordPress may query the database before deciding that the request is invalid.
Firewall tuning can stop a significant portion of this activity before it reaches those expensive application layers.
Therefore, these measurements represent tuned production servers, not systems intentionally exposed to unrestricted hostile traffic.
At the same time, the filtering certainly didn’t create sanitized laboratory conditions. The 24-hour access logs still contained thousands of requests to /xmlrpc.php, /wp-login.php, and other frequently attacked WordPress endpoints.
These servers were still dealing with the Internet.
For another interesting look at WordPress server security, check out our article, “The 12 Most Abused WordPress URLs Hackers Hit First,” which examines the WordPress endpoints most frequently targeted by automated attacks.
Cloudflare Is Another Important Variable
There is another architectural difference that needs to be disclosed.
Both Hestia servers were completely behind Cloudflare during the testing period. Their production websites used Cloudflare as their public-facing proxy.
The cPanel server had a mixed configuration. Some sites used Cloudflare while others connected more directly to the origin.
That can affect a comparison in several ways.
Cloudflare can filter unwanted traffic before it reaches the origin, serve cacheable content from its edge network, terminate client connections, and influence externally measured network response times.
Consequently, the 24-hour workload figures should be viewed as measurements of the complete production architectures, not just the control-panel software.
For the external response-time tests, however, I deliberately selected Cloudflare-proxied websites on both architectures. That reduced one of the largest potential differences when comparing externally observed response times.
This distinction will become particularly important when we look at cached versus uncached requests.
First, How Busy Were These Servers?
Before comparing memory or response time, we need to understand the workloads.
I analyzed approximately 24 hours of Apache access logs from each server.
The results were striking.
| METRIC | HESTIASERVER1 | HESTIASERVER2 | CPANELSERVER |
|---|---|---|---|
| Production sites/logs represented | 29 | 9 | 4 primary sites |
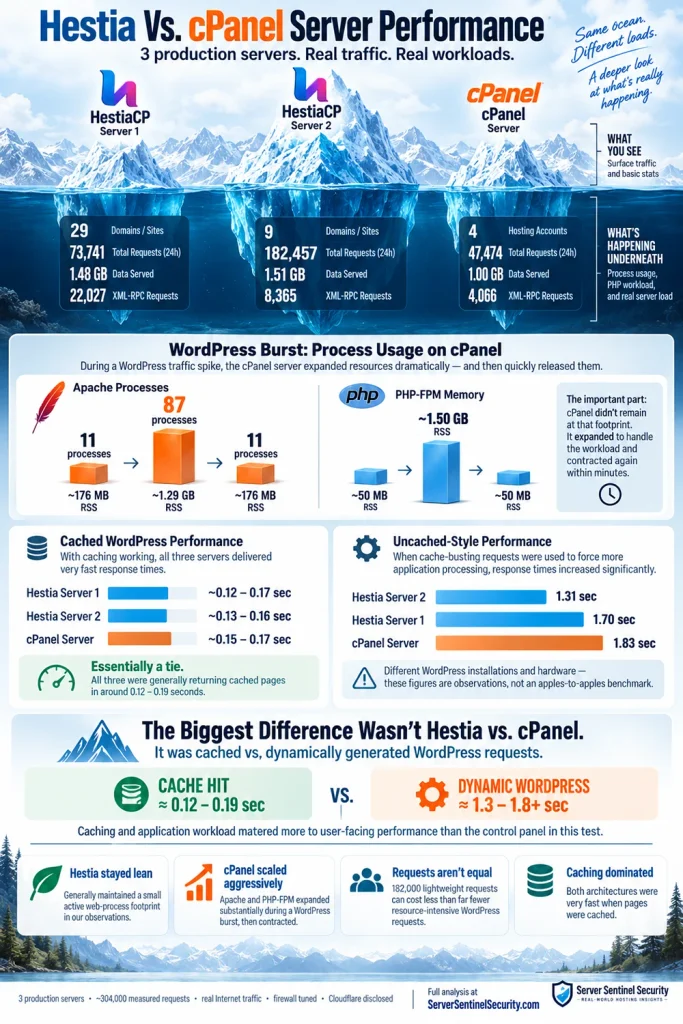
| HTTP requests | 73,741 | 182,457 | 47,474 |
| Data returned | 1.48 GB | 1.51 GB | 1.00 GB |
| 4xx responses | 15,882 | 8,517 | 9,113 |
| 5xx responses | 1,047 | 1,281 | 647 |
| XML-RPC requests | 22,027 | 8,365 | 4,066 |
| WP-login requests | 9,902 | 4,739 | 2,002 |
| WP-cron requests | 11,158 | 7,237 | 3,665 |
| Admin-AJAX requests | 87 | 697 | 2,623 |
One result immediately stands out.
hestiaserver2 processed approximately 182,000 requests in the measured period—nearly four times the logged request volume of cpanelserver.
Yet during our resource snapshots, hestiaserver2 was remarkably quiet.
Its load average at one measurement was:
0.07, 0.07, 0.09
At another point it was:
0.43, 0.20, 0.11
So request count alone clearly doesn’t tell us how hard a server is working.
And that leads us to memory.
What Is RSS, and Why Are We Measuring It?
Throughout this comparison, I use RSS, or Resident Set Size, as one of the primary ways of examining process memory.
RSS represents the amount of a process’s memory that is currently resident in physical RAM.
For example, if a PHP-FPM worker reports an RSS of 100 MB, approximately 100 MB of memory associated with that process is presently resident in RAM.
There is an important technical qualification.
RSS can include memory pages shared between processes. If ten PHP-FPM workers load some of the same libraries, simply adding their RSS figures together can count portions of shared memory more than once.
Therefore:
Summed RSS should not be interpreted as an exact measurement of uniquely consumed physical RAM.
It is better thought of as an operational measure of the process memory footprint.
That’s still extremely useful here.
We’re interested not only in total system memory utilization but also in how many processes each architecture maintains and how their footprints expand and contract as workloads change.
HestiaCP’s Resource Footprint
During one detailed snapshot of hestiaserver1, the primary server components had approximately the following RSS footprints:
| COMPONENT | RSS |
|---|---|
| MariaDB | ~1,027 MB |
| PHP-FPM | ~640 MB |
| nginx | ~84 MB |
| Apache | ~81 MB |
| Redis | ~54 MB |
PHP-FPM was serving several active pools.
Two of the busier sites accounted for approximately:
website1        2 workers     ~212 MB RSS
website2        2 workers     ~228 MB RSS
Despite hosting 29 configured web domains, the overall system remained comfortable.
The load average at that snapshot was:
0.55, 0.58, 0.66
This illustrates one of Hestia’s architectural characteristics.
Its default web stack can use nginx in front of Apache, allowing nginx to efficiently handle connections and static content while Apache and PHP handle requests that actually require application processing.
But hestiaserver2 provided an even more interesting example.
HestiaServer2: More Traffic, Smaller Active Footprint
Hestiaserver2 hosted only nine configured web domains, but it handled the highest request volume in the 24-hour workload sample:
182,457 requests.
At the moment we measured PHP-FPM, there were only five active workers for the primary busy site:
5 workers
~131 MB combined RSS
Including PHP-FPM master processes, the total PHP-FPM RSS was approximately:
212 MB
And the server load was only:
0.07, 0.07, 0.09
This is particularly interesting because much of the server’s traffic came from a non-WordPress application generating a large number of relatively inexpensive requests.
The lesson isn’t simply that “182,000 requests are easy.”
It’s that:
Important context: These measurements were taken after the server firewalls had been tuned to substantially reduce hostile traffic.
A server can process enormous numbers of lightweight requests while remaining nearly idle, while a much smaller number of expensive WordPress requests can consume substantially more CPU and memory.
Now Look at cPanel
The cPanel server presented a very different pattern.
It had only four hosting accounts and approximately 47,000 logged requests during the measured 24-hour period.
At a quiet daytime snapshot, it looked excellent.
PHP-FPM had only one active site worker:
PHP-FPM total RSS: ~77 MB
Apache:             ~178 MB
MariaDB:            ~614 MB
Redis:               ~38 MB
System memory showed:
15 GiB total
2.8 GiB used
12 GiB available
0 swap in use
And load average was:
0.47, 0.36, 0.35
There is nothing unhealthy about those numbers.
In fact, the server was extremely comfortable.
But a snapshot taken several hours earlier captured something very different.
The cPanel Server During a WordPress Burst
During the earlier measurement, one WordPress site suddenly had eight active PHP-FPM workers.
Those workers were consuming approximately:
1,365 MB RSS
Another WordPress site had an additional active worker using approximately:
86 MB RSS
Total PHP-FPM RSS reached roughly:
1,502 MB
Apache simultaneously had:
87 processes
~1,286 MB combined RSS
The server’s load average reached:
2.09, 1.12, 0.84
On a two-core server, a one-minute load average above 2 is significant enough to notice.
But what happened next is even more revealing.
Three Minutes Later
Approximately three minutes later, the burst had ended.
PHP-FPM dropped from:
~1,502 MB
to:
~50 MB
Apache dropped from:
87 processes / ~1,286 MB
to:
11 processes / ~176 MB
And load average fell to:
0.49, 0.92, 0.82
A minute later:
0.38, 0.80, 0.78
By the daytime sample several hours later, the server was back to essentially idle conditions.
This is one of the most important observations in the entire test.
The cPanel server wasn’t continuously consuming huge amounts of memory.
It expanded aggressively to handle a burst and then contracted again.
That’s not necessarily inefficient behavior.
It is an architectural tradeoff.
Memory Usage Doesn’t Automatically Mean Poor Performance
It’s tempting to look at the 1.5 GB PHP-FPM footprint and 1.3 GB Apache footprint and declare cPanel inefficient.
That conclusion isn’t justified by these measurements.
Memory exists to be used.
If additional workers allow a server to process concurrent requests more quickly, allocating available RAM can be exactly the correct behavior.
The cPanel server had 15 GB of RAM and approximately 11–12 GB available under normal conditions. It wasn’t close to memory exhaustion and wasn’t swapping.
The more meaningful questions are:
What caused those processes to expand?
How quickly did they complete the work?
Did users experience slower responses?
That is why we also measured external response times.
Cached Response-Time Testing
For the external tests, I selected:
- a WordPress site on Hestia;
- another WordPress site on Hestia;
- a WordPress/WooCommerce site on cPanel.
All three were behind Cloudflare.
Thirty consecutive requests were made to each site while measuring connection time, TLS establishment, time to first byte, and total request time.
Once caches were warm, all three performed extremely well.
Typical total response times were roughly in the 0.12–0.19 second range.
In practical terms, the differences between the platforms under cached conditions were small enough that users would be unlikely to perceive them.
That shouldn’t be surprising.
When Cloudflare or a local page cache can serve a completed page, much of WordPress, PHP, and database processing is removed from the request path.
So we performed a second test.
Forcing the Request Back Toward WordPress
For the second series, a unique query parameter was added to each request.
The goal was not to produce a perfect laboratory cache bypass, but to approximate an uncached-style request that required substantially more origin/application processing.
The difference was dramatic.
Hestia WordPress Site 1
Typical time to first byte was approximately:
1.6–1.9 seconds
Hestia WordPress Site 2
Typical time to first byte was approximately:
1.25–1.4 seconds
cPanel WordPress/WooCommerce Site
Typical time to first byte was approximately:
1.7–2.0 seconds
There were occasional slower responses on all systems, including a cPanel sample approaching 2.8 seconds.
These numbers shouldn’t be interpreted as a pure benchmark of Hestia versus cPanel. The WordPress installations aren’t identical. Their plugins, themes, databases, page complexity, and application behavior differ.
But they reveal something important.
The Cache Matters More Than the Control Panel
With caching working, all three sites routinely returned pages in a fraction of a second.
When the requests forced substantially more application processing, response times increased by roughly an order of magnitude.
That difference was much larger than the normal cached-performance difference between Hestia and cPanel.
This suggests a practical lesson that may matter more than the choice of control panel:
For WordPress hosting, caching strategy and application efficiency can have a much greater impact on user-facing performance than whether the server is managed by HestiaCP or cPanel.
That’s an important result.
It also helps explain the cPanel resource spike.
A burst of expensive WordPress requests can cause PHP-FPM and Apache to rapidly create or activate workers. Cached requests may never generate comparable application workload.
So Did HestiaCP Win?
Not exactly.
But the Hestia architecture did demonstrate something impressive.
One Hestia server hosted 29 configured domains while maintaining a relatively modest active web-server footprint.
The second processed approximately 182,000 requests in 24 hours while showing extremely low load during our snapshots.
The cPanel server handled considerably fewer logged requests but exhibited a much larger temporary process expansion during a burst of WordPress activity.
That makes Hestia’s architecture look particularly efficient for hosting many relatively lightweight websites and applications.
But there’s an important qualification.
The workloads weren’t equivalent.
The cPanel server’s four accounts were WordPress-focused, and one included a WooCommerce installation. Dynamic WordPress requests can be dramatically more expensive than the lightweight application requests responsible for much of hestiaserver2’s traffic.
Therefore, the data supports this statement:
In these production environments, the Hestia servers maintained a smaller and more stable active web-process footprint despite hosting more sites and, in one case, processing substantially more requests.
The data does not prove:
HestiaCP inherently uses less resources than cPanel under every equivalent workload.
That would require a controlled benchmark.
Architecture Matters—But Workload Matters More
Perhaps the most valuable result from this comparison is that “number of websites” and “number of requests” are poor predictors of server requirements.
Consider the extremes we observed.
One server processed approximately:
182,000 requests/day
while sitting at a load average near:
0.07
Another server experienced a temporary WordPress burst that pushed PHP-FPM to:
~1.5 GB RSS
and Apache to:
~1.3 GB RSS
despite handling only about:
47,000 logged requests
during the measured 24-hour period.
The difference wasn’t simply control-panel overhead.
It was what those requests asked the servers to do.
Serving an advertisement frame, cached page, static asset, or simple PHP response is fundamentally different from bootstrapping WordPress, loading dozens of plugins, querying a WooCommerce database, generating a page, and returning it through PHP-FPM.
Hestia vs. cPanel Server Performance: What the Real-World Data Suggests
After examining process counts, memory footprints, request volume, application mix, and external response times, I came away with several conclusions:
- Both architectures can deliver excellent cached WordPress performance. In these tests, normal cached responses from both platforms were commonly well below 200 milliseconds.
- Hestia demonstrated an impressively lean active web-process footprint. This was particularly notable considering the number of domains on hestiaserver1 and the request volume handled by hestiaserver2.
- cPanel scaled its process footprint much more dramatically during a WordPress burst. PHP-FPM and Apache expanded rapidly and then contracted after the workload disappeared.
- That expansion isn’t necessarily a performance defect. The cPanel server had ample unused memory and no swap pressure. Using RAM to handle concurrency can be desirable.
- Application workload matters enormously. A few thousand expensive WordPress requests may consume more resources than tens of thousands of lightweight application requests.
- Caching produced the largest performance difference observed in the external tests. The difference between cached and uncached-style WordPress responses was much larger than the typical cached difference between Hestia and cPanel.
- Security configuration is part of performance engineering. Preventing repetitive malicious requests from reaching PHP and WordPress reduces work that provides no benefit to legitimate users.
- Cloudflare must be considered part of the production architecture. Both Hestia servers were fully proxied, while the cPanel server had a mixed deployment. For the direct response-time comparison, Cloudflare-proxied sites were deliberately selected from both platforms.
Hestia vs. cPanel Server Performance, Was Hestia the Winner?
So, HestiaCP or cPanel—which architecture performs better under real-world conditions?
Based on these three production servers, HestiaCP demonstrated the leaner and more stable active web-serving footprint.
That is a meaningful result.
But it isn’t the same as proving that HestiaCP is universally faster.
cPanel’s larger temporary footprint occurred while processing a burst of relatively expensive WordPress activity, and the server had ample memory available to handle it. Once that workload disappeared, its PHP-FPM and Apache footprint collapsed rapidly.
From the user’s perspective, both architectures were capable of excellent cached response times.
The biggest Hestia Vs. Cpanel Server Performance difference I measured wasn’t between the control panels themselves.
It was between cached and dynamically generated WordPress requests.
And that may be the most useful conclusion of the entire experiment.
For a production server administrator, choosing a control panel certainly affects architecture and resource utilization. But effective caching, properly configured PHP-FPM pools, application efficiency, firewall tuning, bot mitigation, database performance, and sensible capacity planning may ultimately matter even more.
These weren’t benchmark servers.
They were real servers doing real work.
And sometimes watching how production systems behave tells us more than another synthetic benchmark ever could.
